Welcome to our comprehensive analysis of the Brantford real estate market, where current trends paint a picture of a dynamic landscape shaped by historical patterns, economic shifts, and evolving buyer preferences. As we delve into October's figures, we find the median sale price of residential homes continuing its upward trajectory at $650,000, marking a steady rise amid fluctuating interest rates and a recovering market from the downturn influenced by the Bank of Canada's previous rate hikes. While the market shows a robust year-over-year price increase, it remains in a state of balance, with a significant portion of sales concentrated in homes under the $800,000 mark and properties listed for less than six weeks demonstrating the highest turnover. Across the region, varying conditions suggest seller-friendly markets to the north and more buyer-aligned environments elsewhere. As we break down the data by neighbourhood, property type, and price points, we uncover distinct segments, each with its unique pulse and pace. The local market is a tapestry of micro-markets, each offering opportunities and trends that will interest homeowners, buyers, and sellers alike.
Enjoy The Video Report Or Browse The Charts And Full Analysis Below:

In October, Brantford's residential resale homes reached a median sale price of $650,000, demonstrating a steady climb of 0.8% from September and a significant 16% from the previous October's low point. This rebound follows the pattern set during the pandemic when high demand and low-interest rates drove prices up rapidly over two years, only for them to fall sharply with the Bank of Canada's aggressive interest rate hikes in 2022. Notably, since October 2022, median sale prices have been on an upward trend despite persistently high-interest rates.

The current median sale price has decreased by 18% from the peak seen in February 2022, yet it has rebounded by 16% from the recent low in October 2022

Detached homes in Brantford lead the market with a median sale price of $695,000. Townhomes follow, with a median price of $580,000. For those seeking more affordability, condominiums offer the lowest median price at $355,000.

Brantford stands as one of the more affordable options near the Greater Toronto Area (GTA). Median residential home prices are 14% higher in Cambridge and 17% more in Guelph. Heading west, a comparable home in Burlington costs 62% more, with prices escalating further as you approach Toronto. Greater affordability is typically found as one moves farther from the GTA.

Pricing in Brantford varies significantly by neighbourhood areas north of Highway 403 command higher prices due to consistent buyer demand. "West Brant," known for its larger and newer homes, boasts the highest median sale price. The Henderson & Holmedale area, situated west of downtown and east of the river, is prized for its historic character and carries a price premium. For those seeking value, the central region north and east of downtown offers more affordable options, while Eagle Place, to the southeast, is the most budget-friendly neighborhood.

Evaluating "dollar per square foot" can provide a clearer perspective on the value attributed to specific neighborhoods. A lower figure indicates that you're getting more house for your money, signifying larger living spaces at a more economical price point. Conversely, a higher number suggests you're paying a premium, often due to the desirability of the area, which typically includes larger lot sizes.
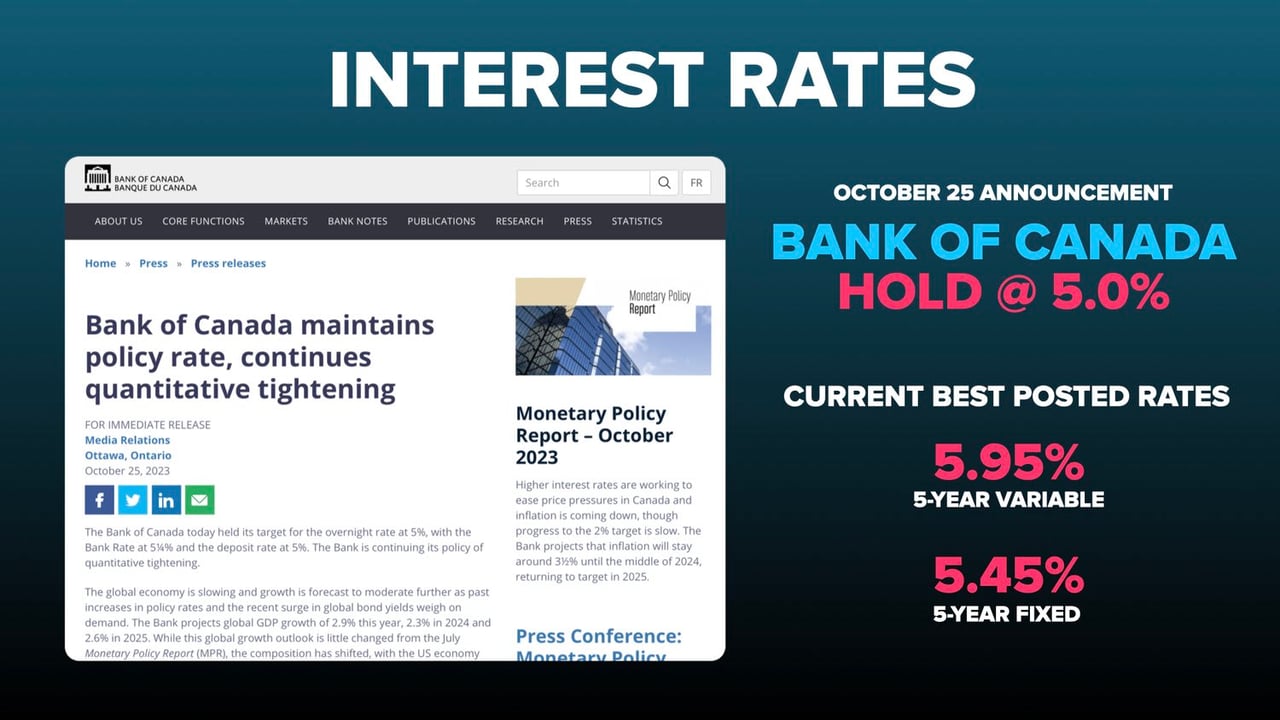
The Bank of Canada's announcement on October 25 to maintain interest rates came as a relief to home buyers and variable mortgage holders, marking the second consecutive hold on rates. Many economists interpret this as a sign that the era of rate hikes may have reached its end, with expectations leaning towards a potential reduction in rates by 2024. Any decrease in the qualifying interest rate would immediately enhance borrowers' affordability, allowing them to qualify for a larger loan with the same monthly payment. The accompanying table illustrates how even minor rate reductions can significantly boost buyer affordability. Given the persistent supply-demand imbalance in our market, any dip in interest rates is likely to swiftly bolster demand and drive prices up.

Home demand in Brantford picked up in October following a quieter September. Sales increased to 117 homes, marking an 18% rise from the previous month and a remarkable 41% surge from the same period last year.

Year-to-date, Brantford has seen 1,280 homes sold, which is a 7% decrease compared to the same period last year, and a substantial 30% drop from the peak demand experienced in 2021.

The influx of new listings in Brantford's market saw a notable decline in October, with only 245 homes entering the market—a 15% decrease from September, which experienced a surge during the back-to-school season. However, this figure represents a 48% increase compared to last October, when the market witnessed an unusually early onset of winter real estate activity.

So far this year, Brantford's MLS system has registered 2,324 new listings, marking a 6% decrease from the previous year yet a slight 3% uptick from 2021. This overall reduction in both supply and demand has contributed to a balanced market dynamic.

In October, a significant 42% of the homes classified as "new" listings in Brantford were, in fact, properties that had been previously listed and didn't sell. Sellers often relist to refresh the listing details such as days on the market on public websites like Realtor.ca. However, this practice can give a misleading impression of the actual number of new listings.
Furthermore, of the homes that were listed in October, 28% sold, and 15% were removed from the market with some being relisted and others withdrawn from sale entirely. This indicates a level of market activity where sellers are adjusting strategies in response to buyer behavior and market conditions.

In October, the average number of homes on the market in Brantford was 340, a slight dip from the 2023 peak of 345 seen in September. This represents a 20% increase in inventory compared to the previous October and is a marked shift from the heated market conditions of 2021, which saw inventory levels range from a high of 157 to a low of just 26 homes for sale. Current trends suggest that inventory levels are likely to decline from this point until January 2024.

Comparing the current total inventory with demand highlights the dramatic change from the pandemic years, when monthly demand exceeded the total inventory, fueling intense competition among buyers in the market. This shift underscores a move away from the frenzied market conditions previously experienced.

The "months of supply" metric is a quantitative indicator of the balance between demand and supply in the real estate market. A lower number suggests a seller's market, where competition among buyers is high and inventory is quickly absorbed. Conversely, a higher number indicates a buyer's market, with more available inventory and less competition.
In September, the months of supply reached a peak at 3.2, which indicated a trend toward a buyer's market. However, it decreased to 2.9 in October, signaling a slight shift back in favor of sellers, as inventory moved more quickly due to increased demand.

This chart delineates the months of supply by property type and also segments the data into specific zones. An extreme seller's market is indicated when the months of supply dips below 1.5, characterized by multiple offers on most properties and swiftly rising prices. A balanced market typically falls within the range of 3.5 to 6 months of supply. Conversely, a definitive buyer's market is recognized when the months of supply exceeds 6, suggesting a slower market with more negotiating power for buyers.

The months of supply, and consequently the market conditions, differ across the region. Cities north of Brantford are experiencing a seller's market, characterized by lower months of supply, indicating more robust demand relative to inventory. Meanwhile, cities in other directions from Brantford are experiencing conditions that lean slightly more towards a buyer's market, with a higher months of supply suggesting a larger inventory relative to demand.

Within the city, the months of supply varies significantly between neighborhoods. The northwest neighborhood of Myrtleville-Mayfair is firmly a seller's market, characterized by low supply and high demand, making it a competitive environment for buyers. In contrast, the southwest neighborhood of West Brant offers more options for buyers, who face less competition.
Notably, the town of Paris is edging towards a buyer's market, with a months supply of 5.1, suggesting buyers there have more leverage and a greater selection of homes from which to choose, with less urgency to make quick decisions.

Segmenting sales and active listings by price point provides a more nuanced understanding of the local market dynamics. The predominance of activity is in the sub-$800,000 category, with 87% of all sales occurring below this threshold, while the remaining 13% of sales are transpiring above the $800,000 mark. These figures reveal a bifurcated market where different segments are operating under distinct conditions, likely influenced by varying degrees of buyer affordability and inventory availability.

Analyzing the market through the lens of how long properties have been listed offers valuable insights. A notable 62% of all sales occur with properties that have been on the market for six weeks or less, indicating a brisk turnover for newer listings. On the other hand, there is a considerable inventory of properties that have been listed for 12 weeks or more, which suggests these homes are not aligning well with buyer demands, possibly due to pricing, condition, location, or other factors that make them less desirable in the current market.

The list-to-sale price ratio is a metric that provides insight into the competitiveness of the housing market. A ratio of 100% means that homes are selling at their listed asking price. Ratios above 100% indicate homes are selling for more than the asking price, often due to bidding wars or high demand. Conversely, ratios below 100% mean homes are selling for less than the asking price, which can be due to various reasons such as less demand, pricing above market value, or other negotiable factors in the sale.
For October, the data shows that 36% of home sales occurred at or above the asking price, illustrating a market where over a third of properties are highly sought after or priced competitively. In contrast, 64% of homes sold below the asking price, indicating that the majority of buyers are finding room to negotiate, and sellers may be adjusting to market conditions that are not as competitive as they might have been previously.

The chart with currently available homes (depicted in blue) juxtaposed with the most recent month of sales (depicted in red) clarifies the most dynamic segments of the market. Homes priced under $800,000 and those listed for less than six weeks are seeing the most activity, emphasizing the importance of competitive pricing and fresh listings in attracting buyers.
This visual also highlights a clear trend: the longer a home remains on the market, the lower its likelihood of selling becomes. This could be a signal to sellers that pricing strategies and home presentation need to be optimized for quick sales, and that lingering on the market may lead to a less favorable sale outcome.
In summary, the Brantford real estate market is a mosaic of opportunities and challenges, with the scales tipping in favor of buyers in some sectors while rewarding sellers in others. For buyers, the current climate underscores the importance of acting decisively on properties priced under $800,000 and those freshly listed, as these segments exhibit the highest levels of competition and liquidity. Sellers, on the other hand, should be mindful of the market's sensitivity to pricing and listing duration; homes that linger on the market beyond six weeks notably lose momentum. To optimize your position, whether buying or selling, tailor your strategy to align with these nuanced market dynamics. Given the complexity of the current real estate landscape, individual circumstances can significantly impact outcomes. I encourage you to engage with a seasoned professional for personalized guidance. Don't hesitate to contact me to discuss how we can navigate the market together to meet your specific real estate goals and leverage the latest trends for your benefit.